Grafana Dashboards with AWS CloudWatch Metrics

Grafana is a multi-platform open-source analytics and interactive visualization web application. It can be used to create graphs, charts, and alerts and allows connections to multiple data sources. In this post, I’ll discuss how to connect to AWS CloudWatch and create Grafana dashboards for AWS services.
IAM User Creation
To use CloudWatch as a Grafana datasource, a dedicated IAM user should be created for Grafana with attached policies attached.
• Create a Grafana user with the CloudWatchReadOnlyAccess policy attached to it. Upon successful creation of the user, create an access key and save the CSV file containing the credentials.


Data Source Configuration
On the Grafana UI, select the configuration tab and click data sources. Search for CloudWatch and select it to configure with the necessary details.
Choose Access & Secret key under Authentication Provider and fill it out using the access and secret key downloaded from the previous step.
Set the default region, e.g., us-east-1, eu-west-1.
Click on the Save & Test button, and you should get a confirmation of a valid connection.


Create Custom Dashboards
Once the CloudWatch data source has been successfully setup, you can begin to create dashboards for AWS services of your choice.
Select the + icon and click Dashboard
Click Add an empty panel
Choose CloudWatch as the data source for the panel
Configure the region, namespace, metric name, statistic, and dimension as shown below
Save and apply
Repeat the steps for whatever metric you want to visualise and create dashboards for different AWS services


Final Dashboard Examples
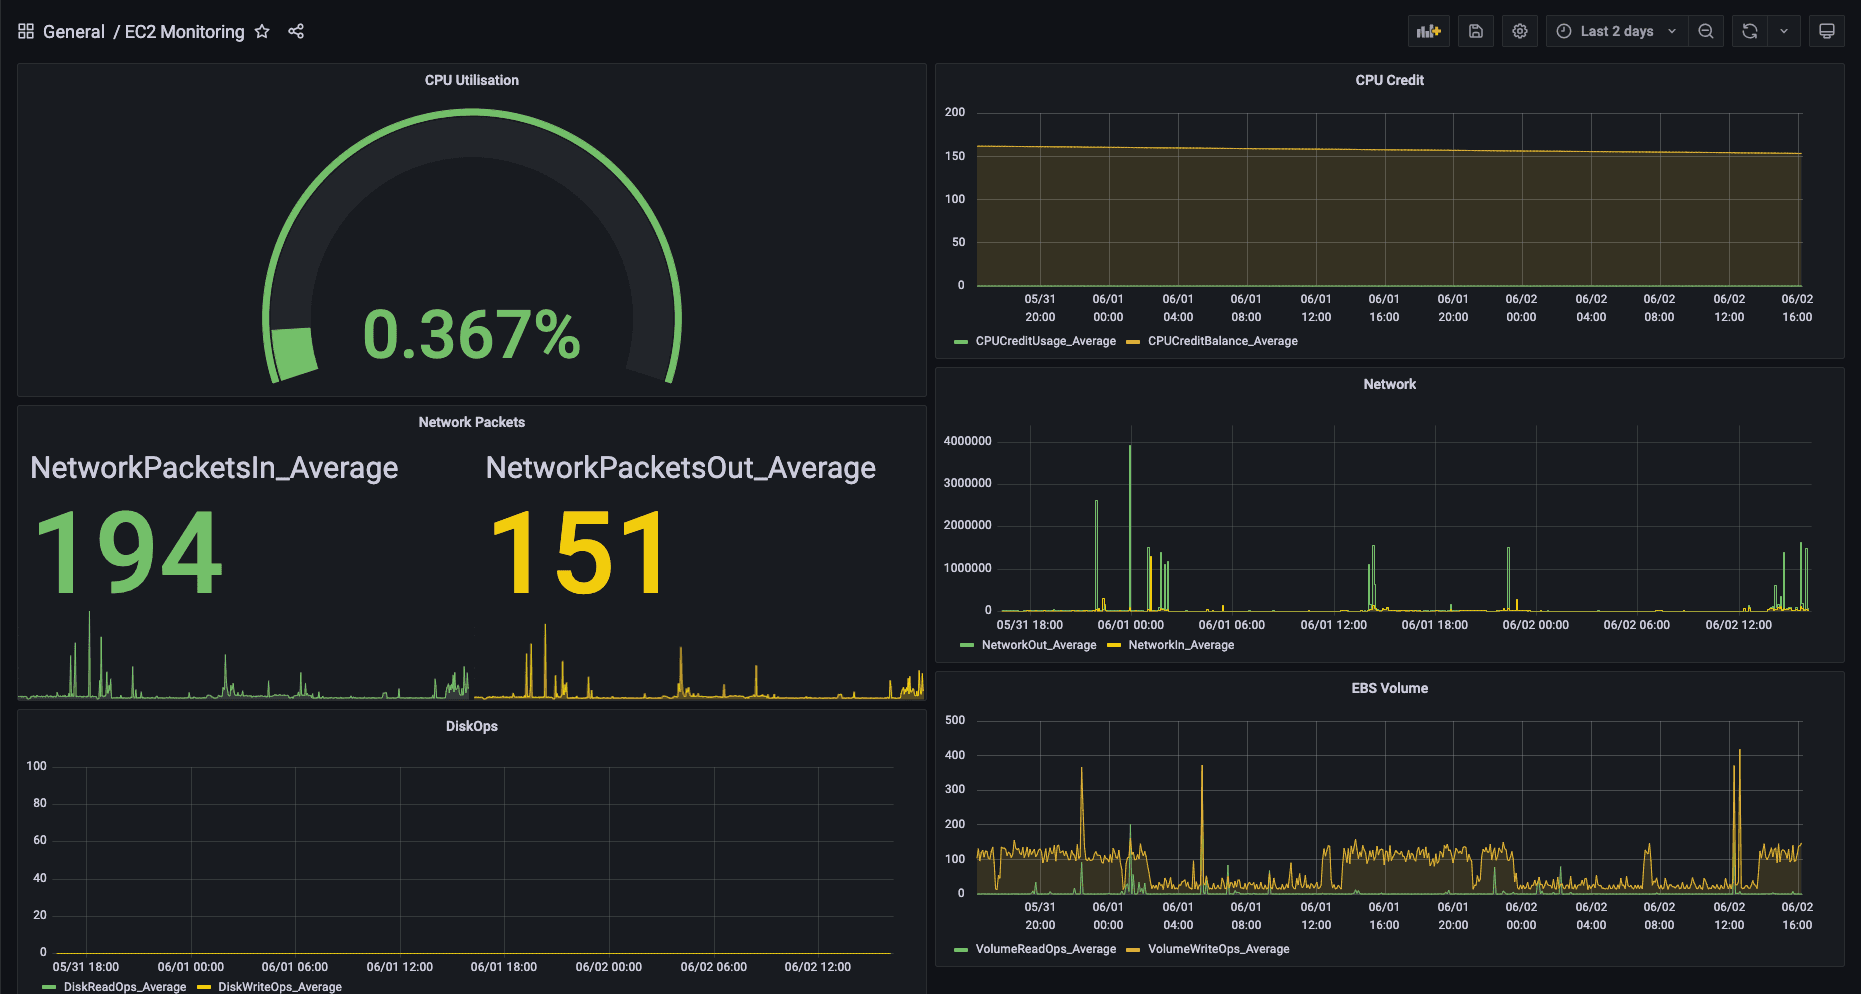
EC2 Instance Dashboard

Lambda Functions Dashboard


